Practice portal › Thermal Properties of Matter › Temperature, Scales and Thermometry
Asked in JEE Main 24th Jan 2nd Shift 2025 · Temperature scales
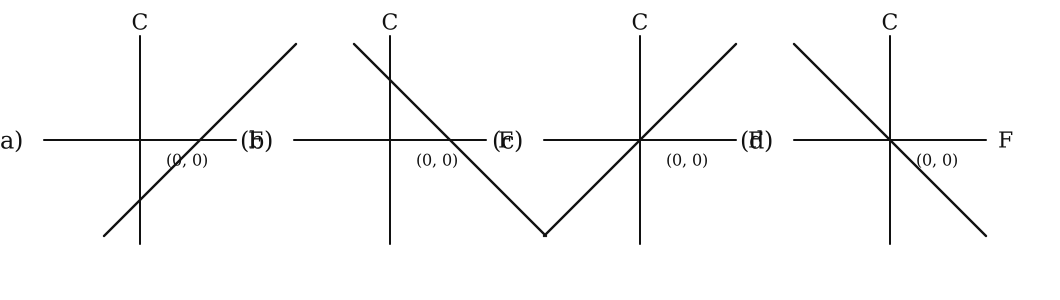
The two scales are related by C=5/9(F-32).
Written as C=5/9F-(160)/9, this is a straight line of slope +5/9, so the graph rises.
C=0 gives F=32, so the line crosses the F-axis at F=32, to the right of the origin.
It is therefore a line of positive slope cutting the F-axis to the right of the origin.
Reading this solution needs no sign-in. You only sign in to practise against the clock and keep your progress.
Practise this with a timer