Practice portal › Dual Nature of Matter and Radiation › Photoelectric Graphs
Asked in GSEB Board March 2022 · Stopping potential and kinetic energy graphs
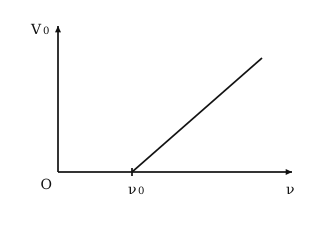
Given: V₀ on the Y-axis, u on the X-axis.
Idea: Kₘₐₓ = h u - φ₀ and Kₘₐₓ = eV₀.
So V₀ = h/e u - (φ₀)/e -- a straight line.
Its slope (Δ V₀)/(Δ u) = h/e, a universal constant that is identical for all metals.
So the slope equals h/e.
Reading this solution needs no sign-in. You only sign in to practise against the clock and keep your progress.
Practise this with a timer