Practice portal › Dual Nature of Matter and Radiation › Photoelectric Graphs
Asked in GSEB Board March 2020 (old course) · Work function from a graph
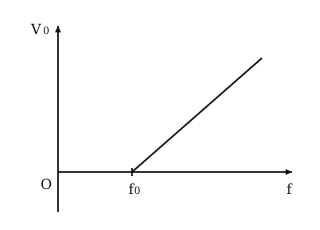
Given: stopping potential V₀ plotted against frequency f, for f > f₀.
Idea: Einstein's equation eV₀ = hf - φ₀, with work function φ₀ = hf₀.
So V₀ = h/ef - (hf₀)/e, a straight line of slope h/e.
The line meets the frequency axis at f₀; extended back to f = 0 it meets the Y-axis at V₀ = -(hf₀)/e = -(φ₀)/e.
So the Y-intercept is -(hf₀)/e.
Reading this solution needs no sign-in. You only sign in to practise against the clock and keep your progress.
Practise this with a timer