Practice portal › Dual Nature of Matter and Radiation › Photoelectric Graphs
Asked in Re-NEET 2026 · Photocurrent against intensity and frequency
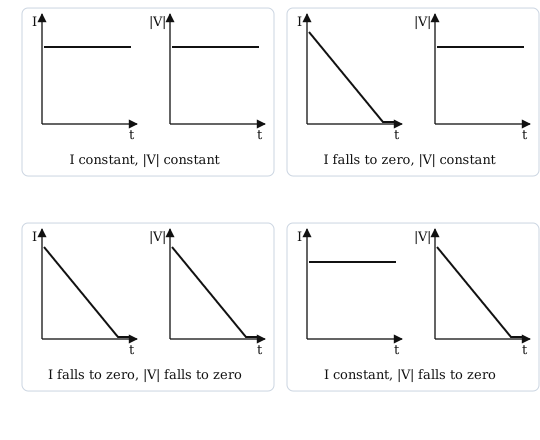
The source keeps the same colour, so every photon still carries the same energy h u.
Power is the energy leaving the source each second, P=nh u with n the number of photons emitted per second, so P∝ n.
If P falls linearly with time then n falls linearly, and the photocurrent, which is proportional to the number of electrons freed per second, falls linearly with it.
The stopping potential comes from eV₀=h u-φ, an expression with no intensity in it at all.
So |V| stays constant while I decreases linearly: graph (B).
Reading this solution needs no sign-in. You only sign in to practise against the clock and keep your progress.
Practise this with a timer