Practice portal › Motion in a Straight Line › Reading Motion Graphs: Slopes and Areas
Asked in JEE Main 23rd Jan 1st Shift 2025 · Area under a graph
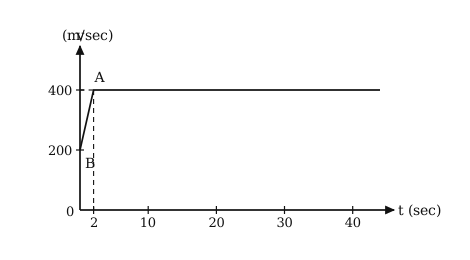
Distance is the area under the v–t graph.
0 to 2 s: velocity rises from 200 to 400 m/s, a trapezium of area 1/2(200 + 400)×2 = 600 m.
2 to 30.5 s: constant 400 m/s for 28.5 s, area 400×28.5 = 11400 m.
Total = 600 + 11400 = 12000 m = 12 km.
Reading this solution needs no sign-in. You only sign in to practise against the clock and keep your progress.
Practise this with a timer