Practice portal › Dual Nature of Matter and Radiation › Photoelectric Graphs
Asked in JEE Main 12th April 1st Shift 2019 · Work function from a graph
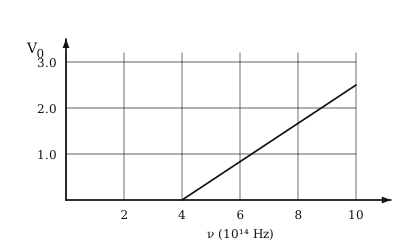
Idea: the line cuts the frequency axis at the threshold frequency.
From the plot, u₀=4×10¹⁴ Hz.
φ=h u₀=6.63×10⁻³⁴×4×10¹⁴=2.65×10⁻¹⁹ J.
φ=(2.65×10⁻¹⁹)/(1.6×10⁻¹⁹)=1.66 eV.
Reading this solution needs no sign-in. You only sign in to practise against the clock and keep your progress.
Practise this with a timer